When I joined the project, the founders had an early concept of what they wanted to build but lacked a clear plan to get there. Despite having already begun building the backend architecture, I recommended taking a step back to clarify the product vision and desired end state to ensure the technology aligned with the long-term goals.
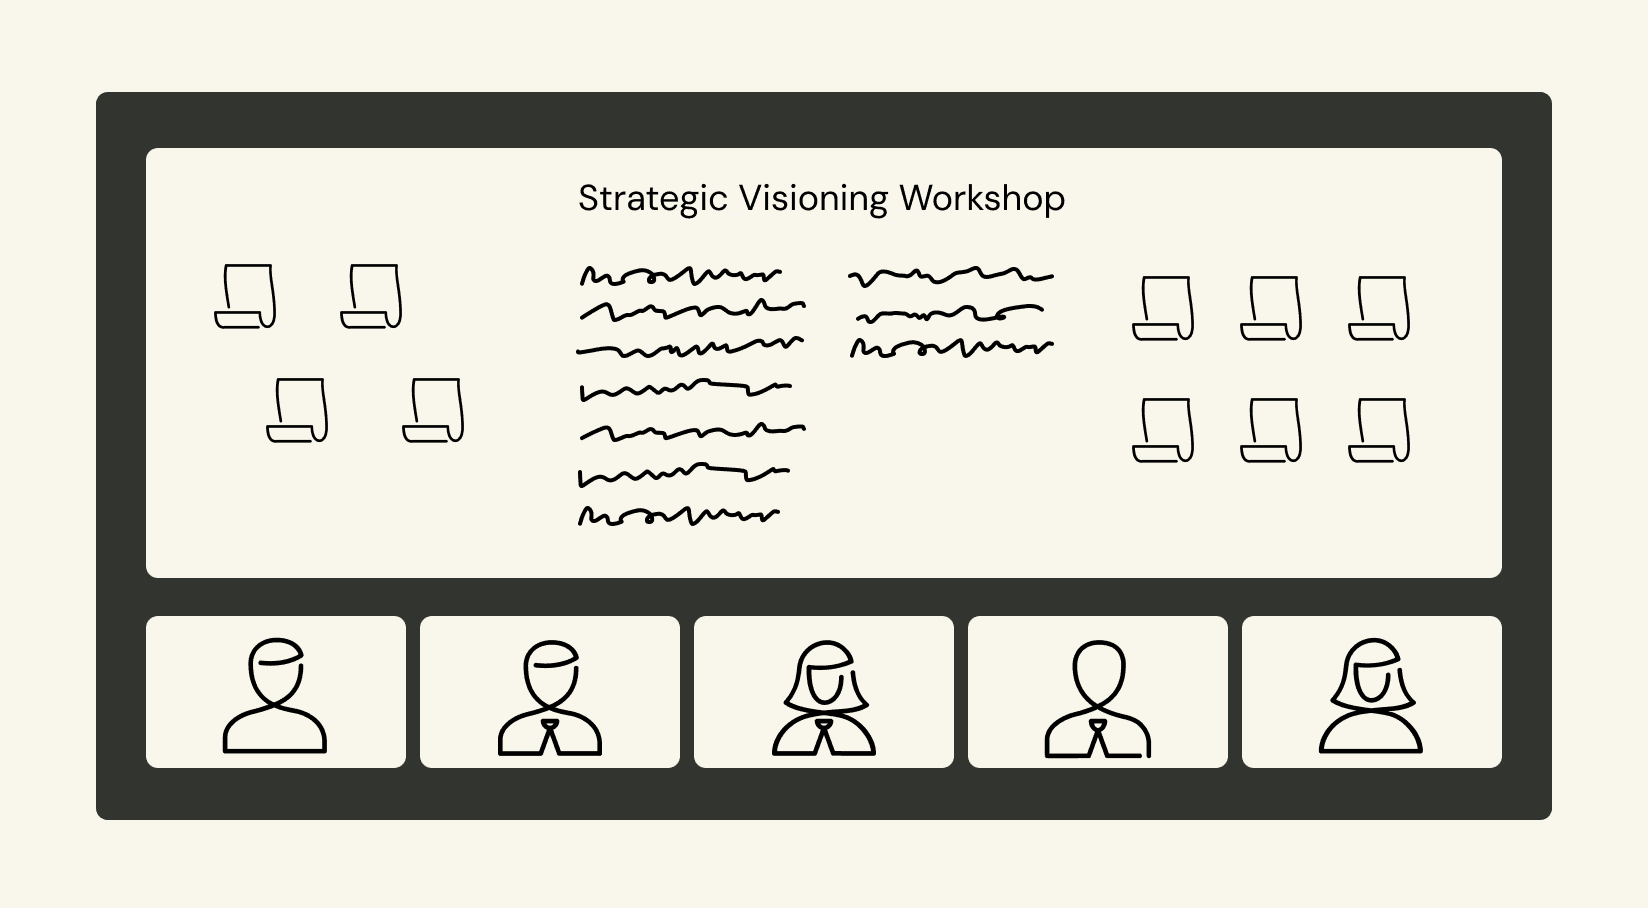
defining a north star
I facilitated a cross-functional product visioning workshop with the CEO, CTO, and core engineering team to align on a clear north star for the product. Through exercises such as vision and mission drafting, future-state user journey mapping, and defining key value propositions, we translated these loosely defined ideas into a coherent product narrative. We documented an ideal state user experience, a concise mission statement, and a set of guiding principles, along with supporting artifacts like a product vision canvas and success metrics. These outputs gave the team a shared language and direction for roadmap planning, design decisions, and technical investment.
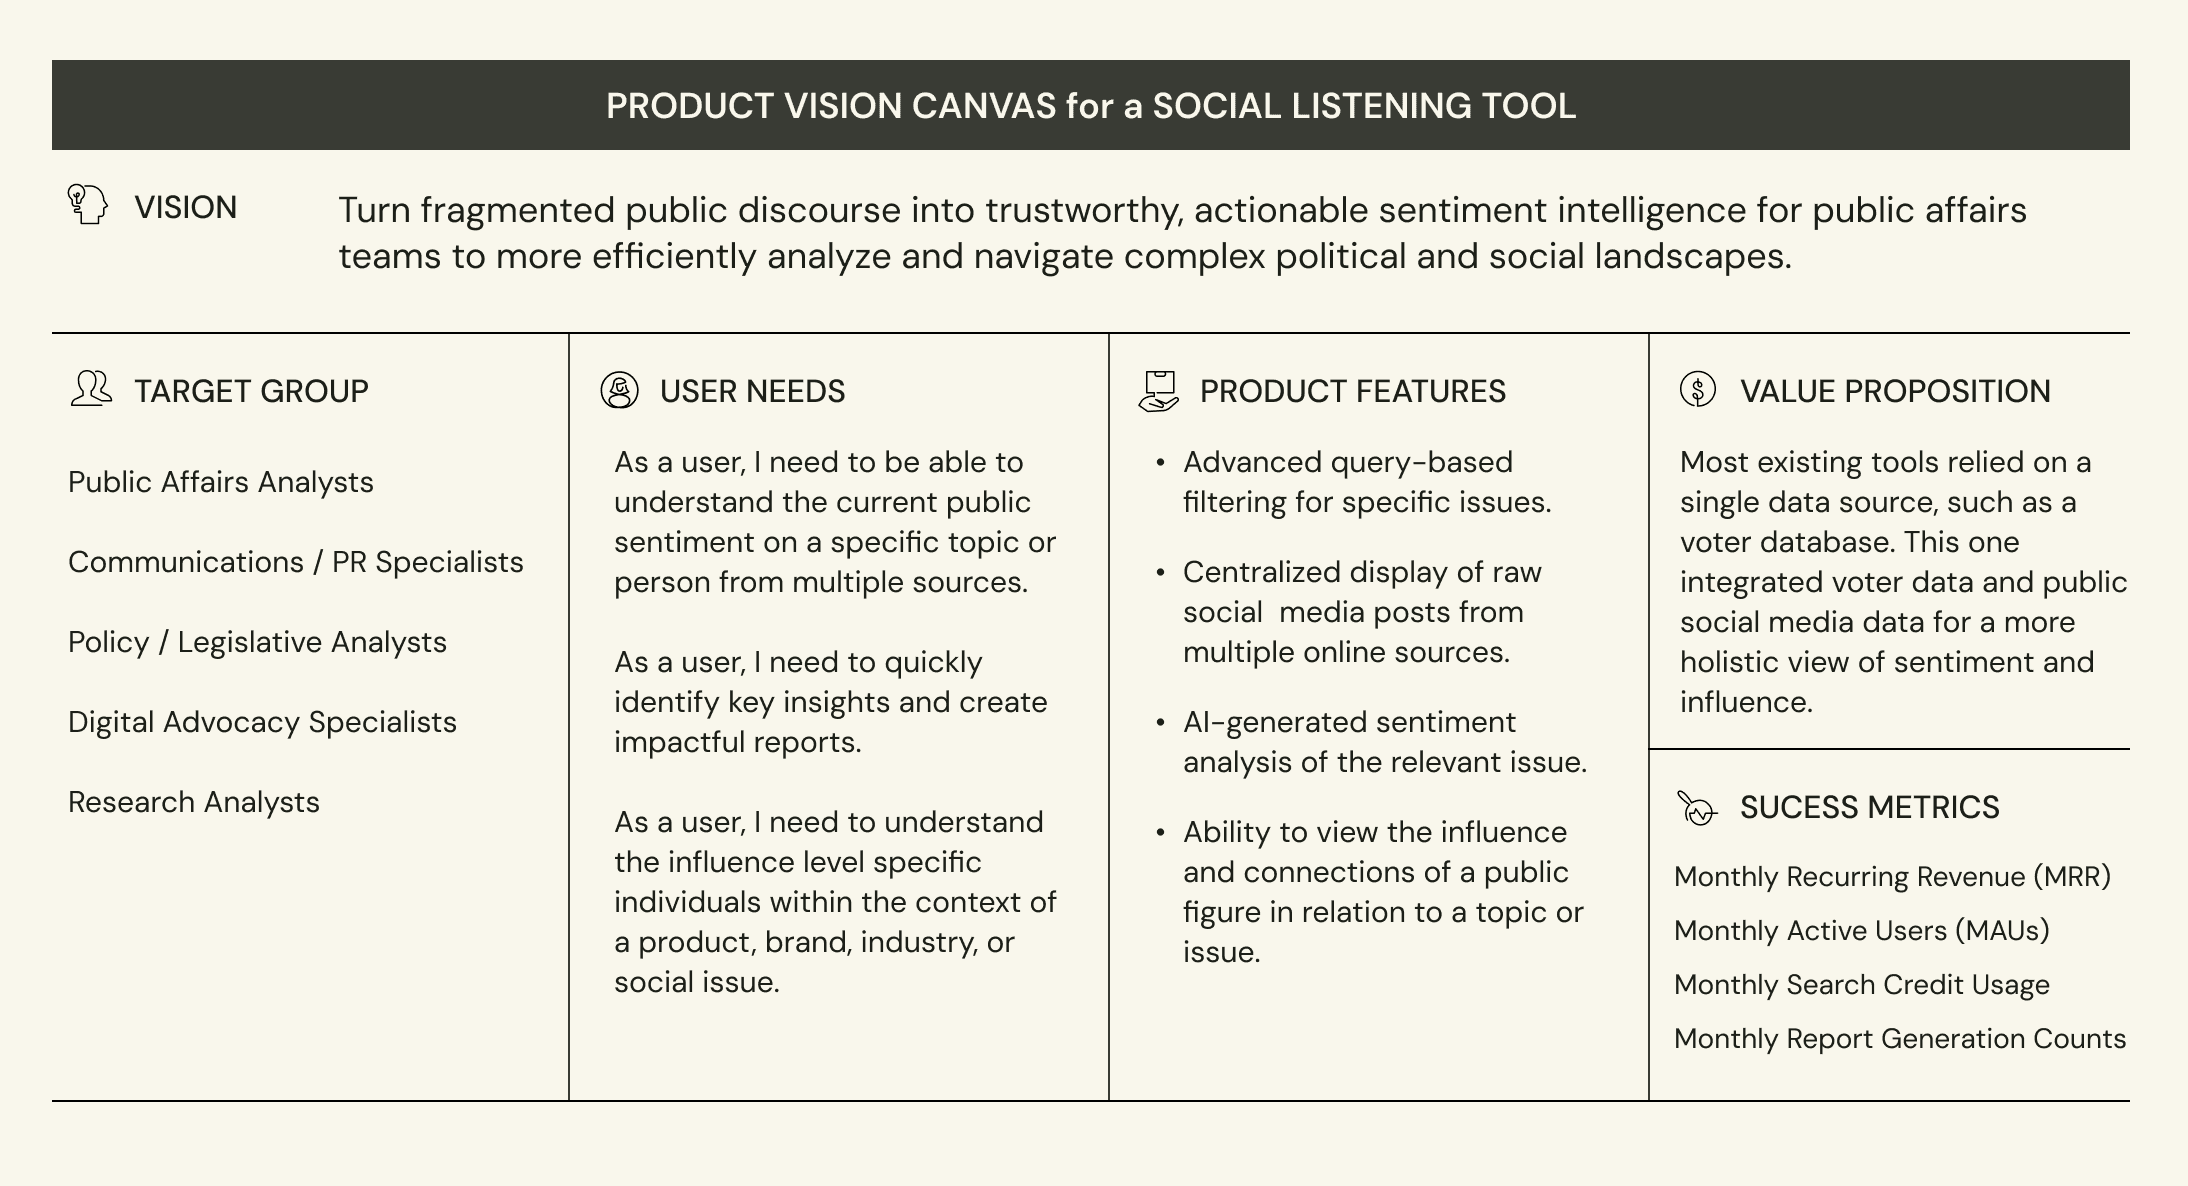
Product vision canvas exercise
This abbreviated version of the exercise is a sample that demonstrates how I applied this framework to align the founders and engineering team towards a crystallized vision of the product. It provided a clear guideline and goal for the team to rally behind and reference later at crucial decision-making points. It also provides the founders with a concise mental model from which to build their business case and go-to-market strategy.
After multiple iterations and several interviews with public affairs analysts and managers, I delivered a cohesive user journey, starting with a query-based search and leading the user through information analysis levels of the social data with increasing detail.
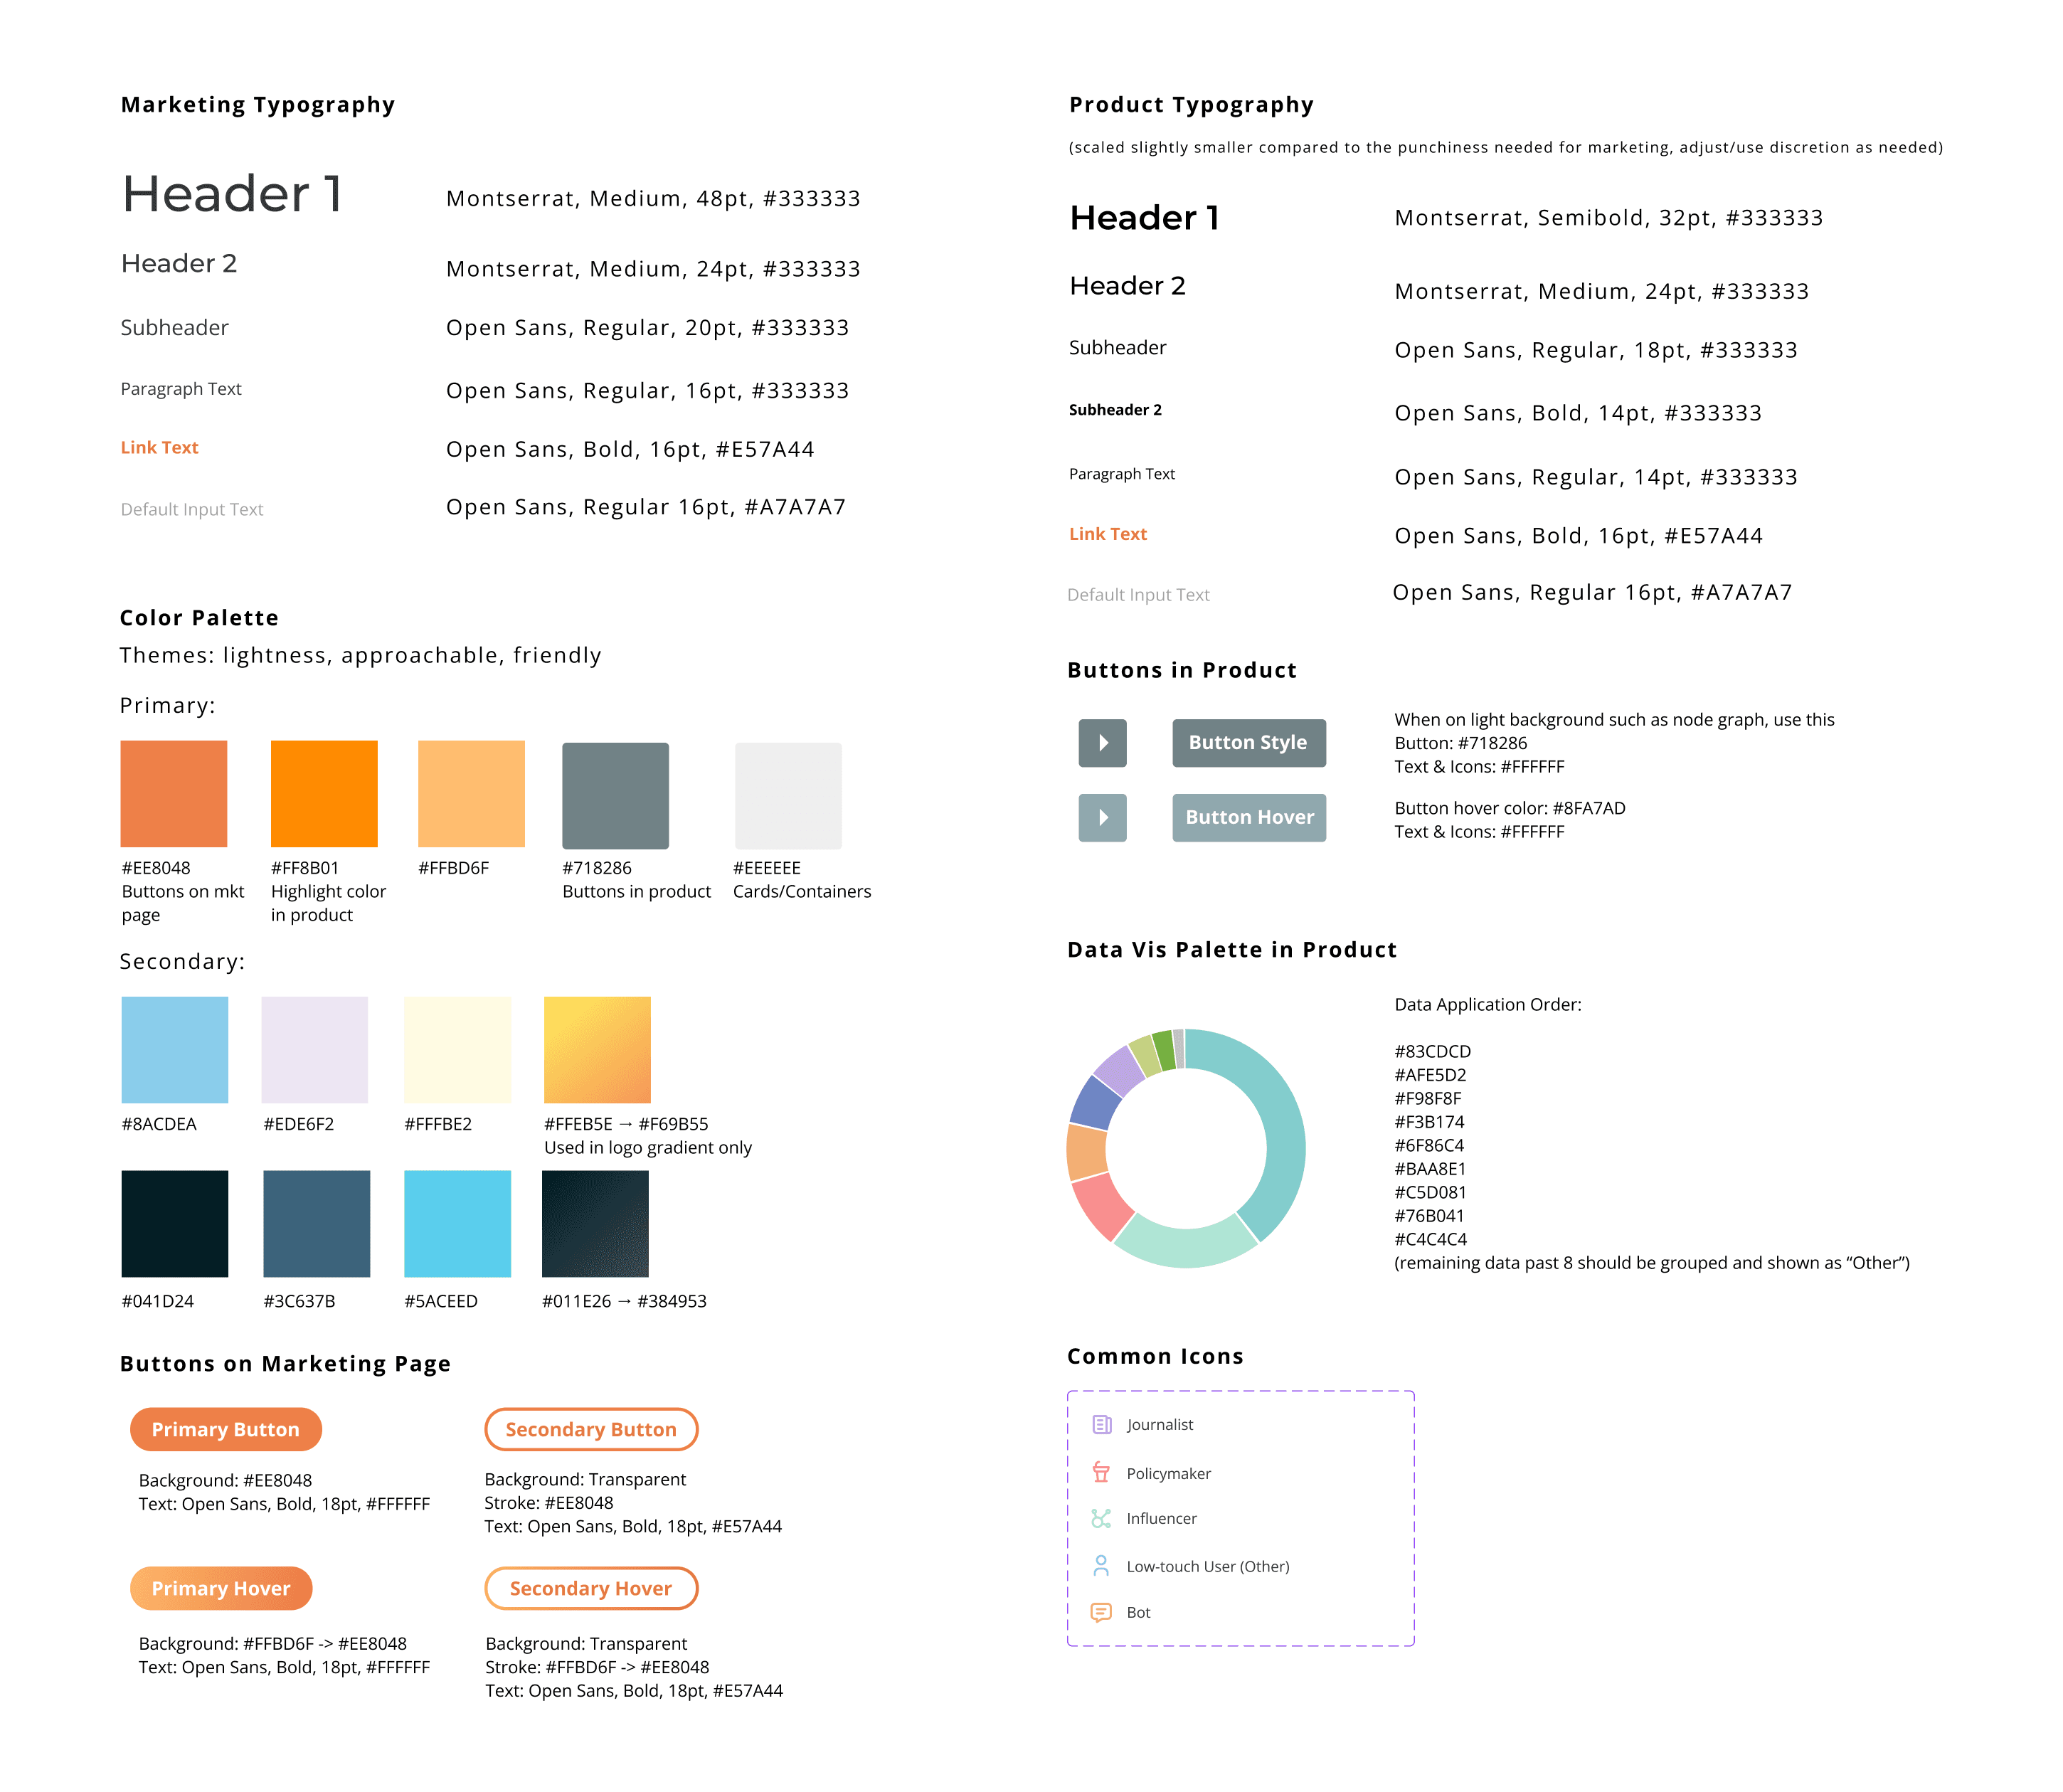
DESIGN DECISIONS
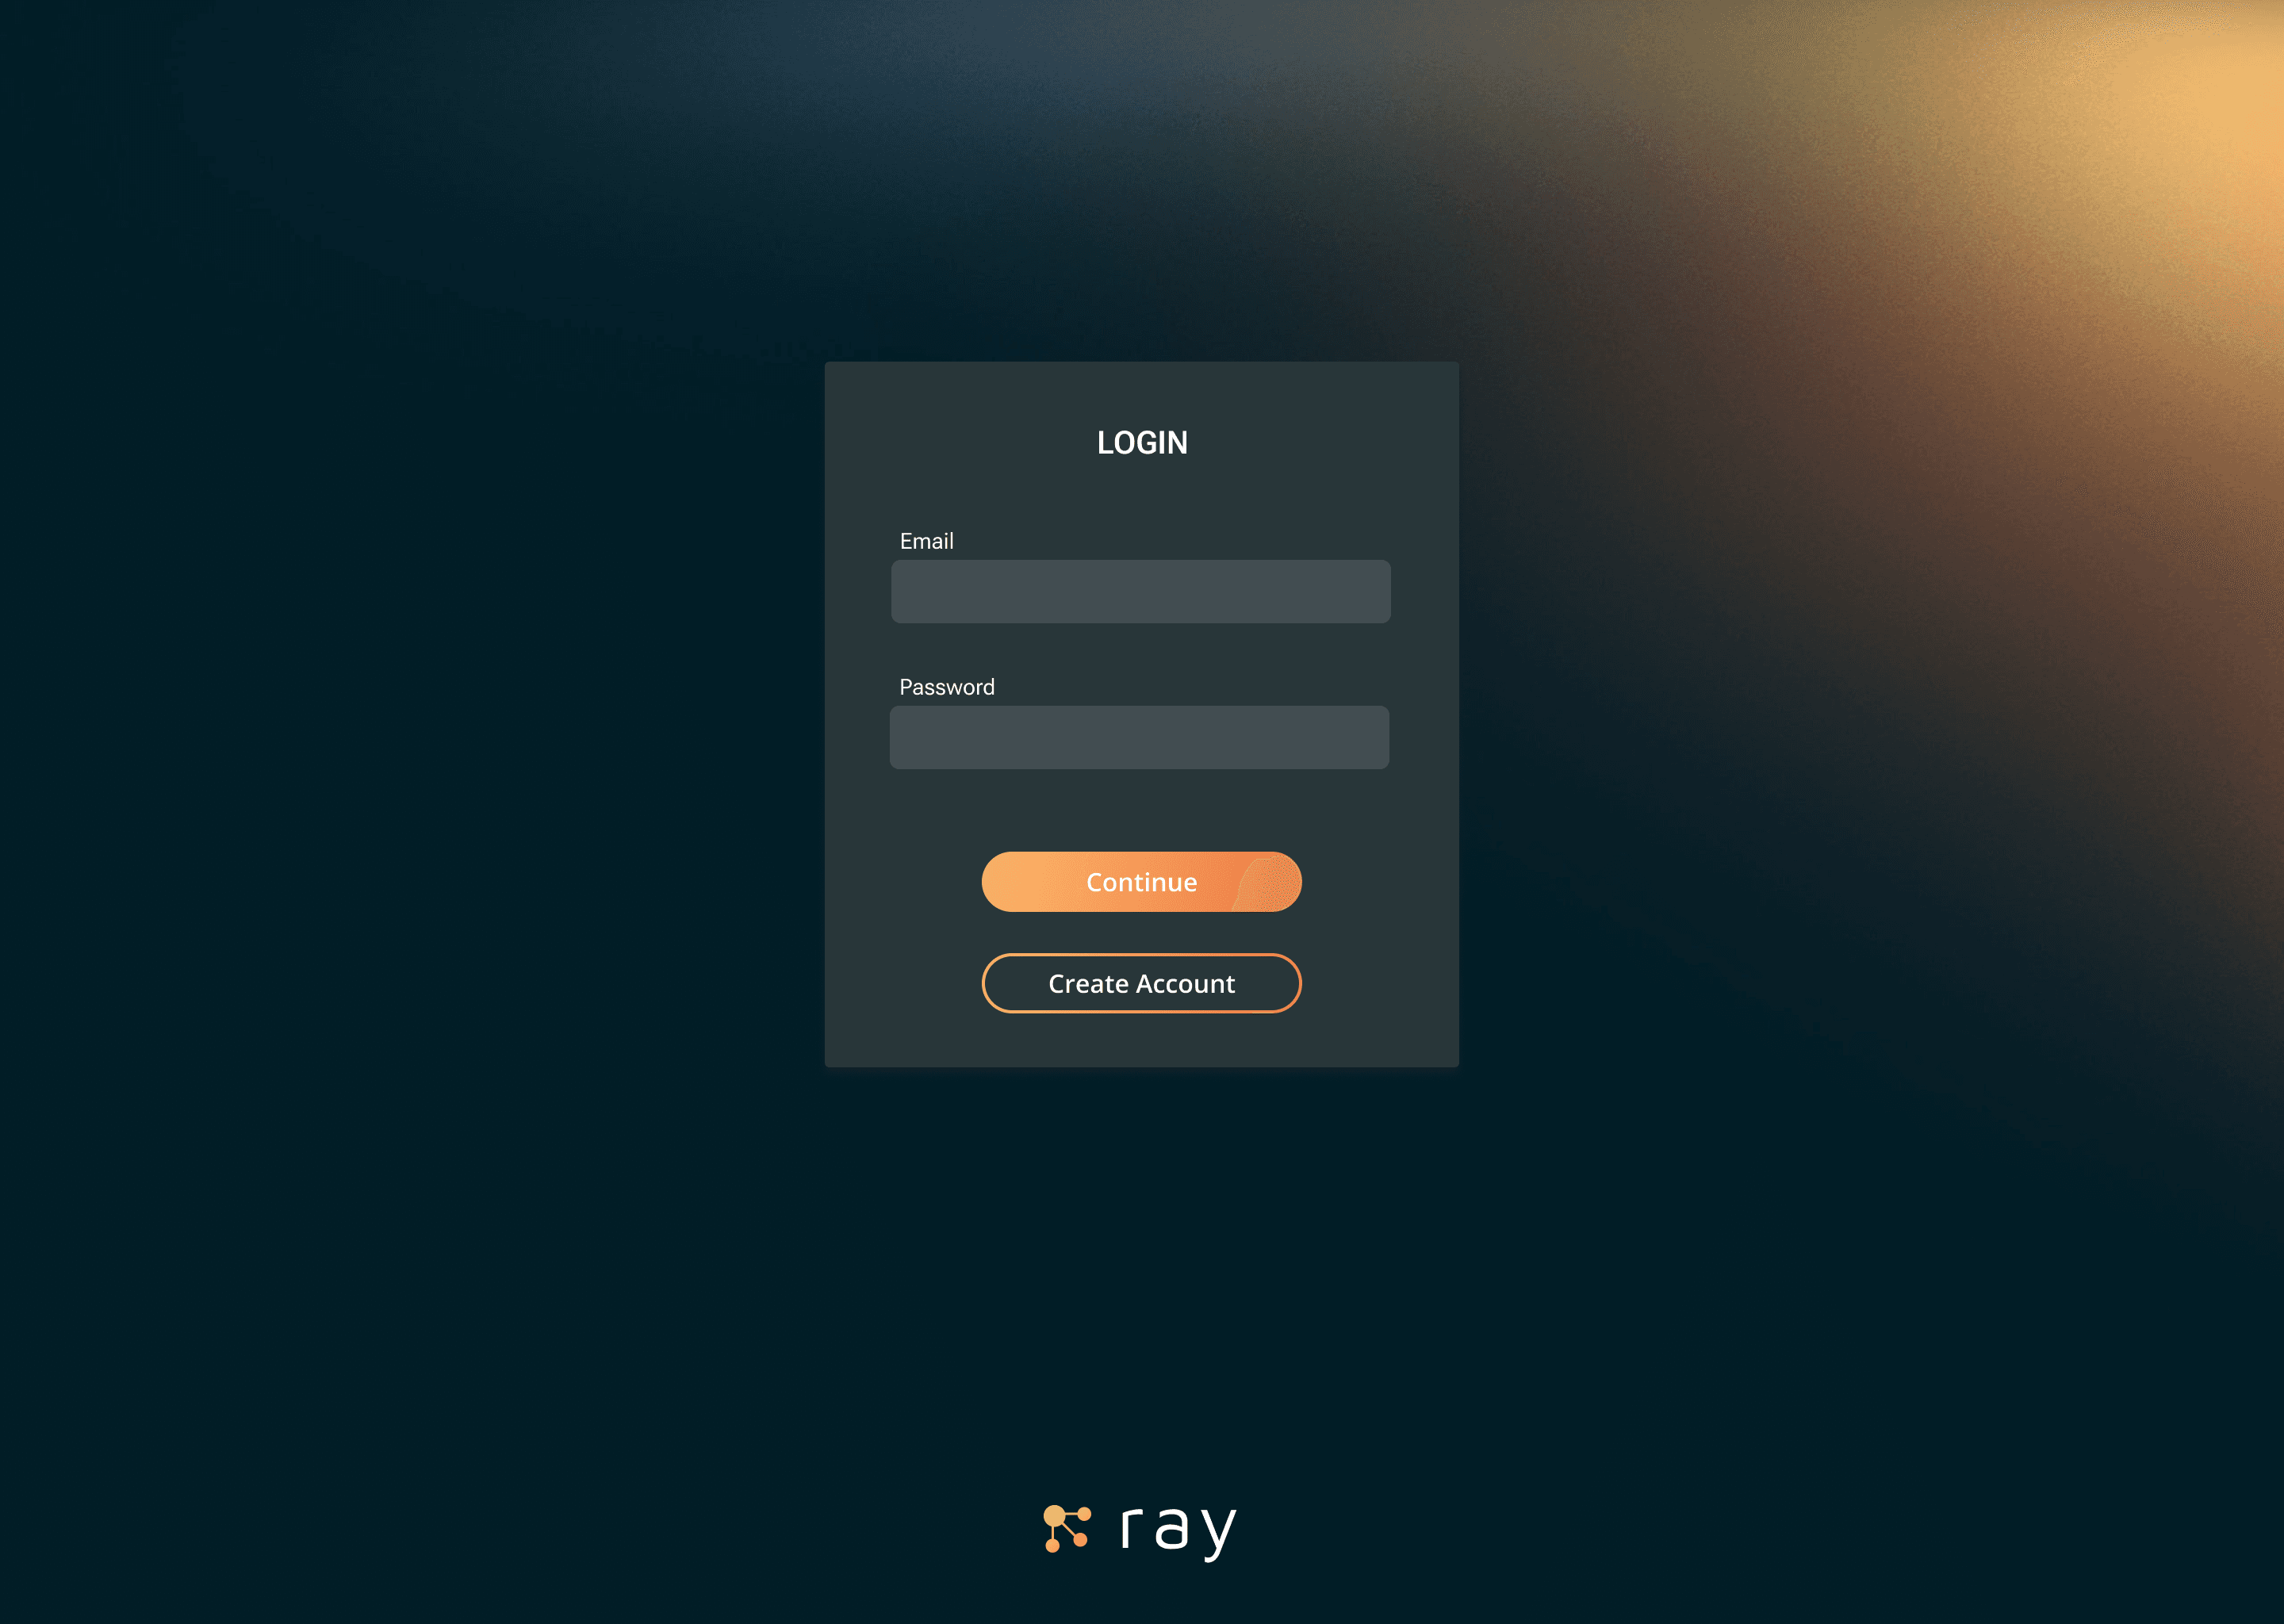
The user journey begins on a login screen with a dark background displaying a gradient communicating the theme of light and illumination.
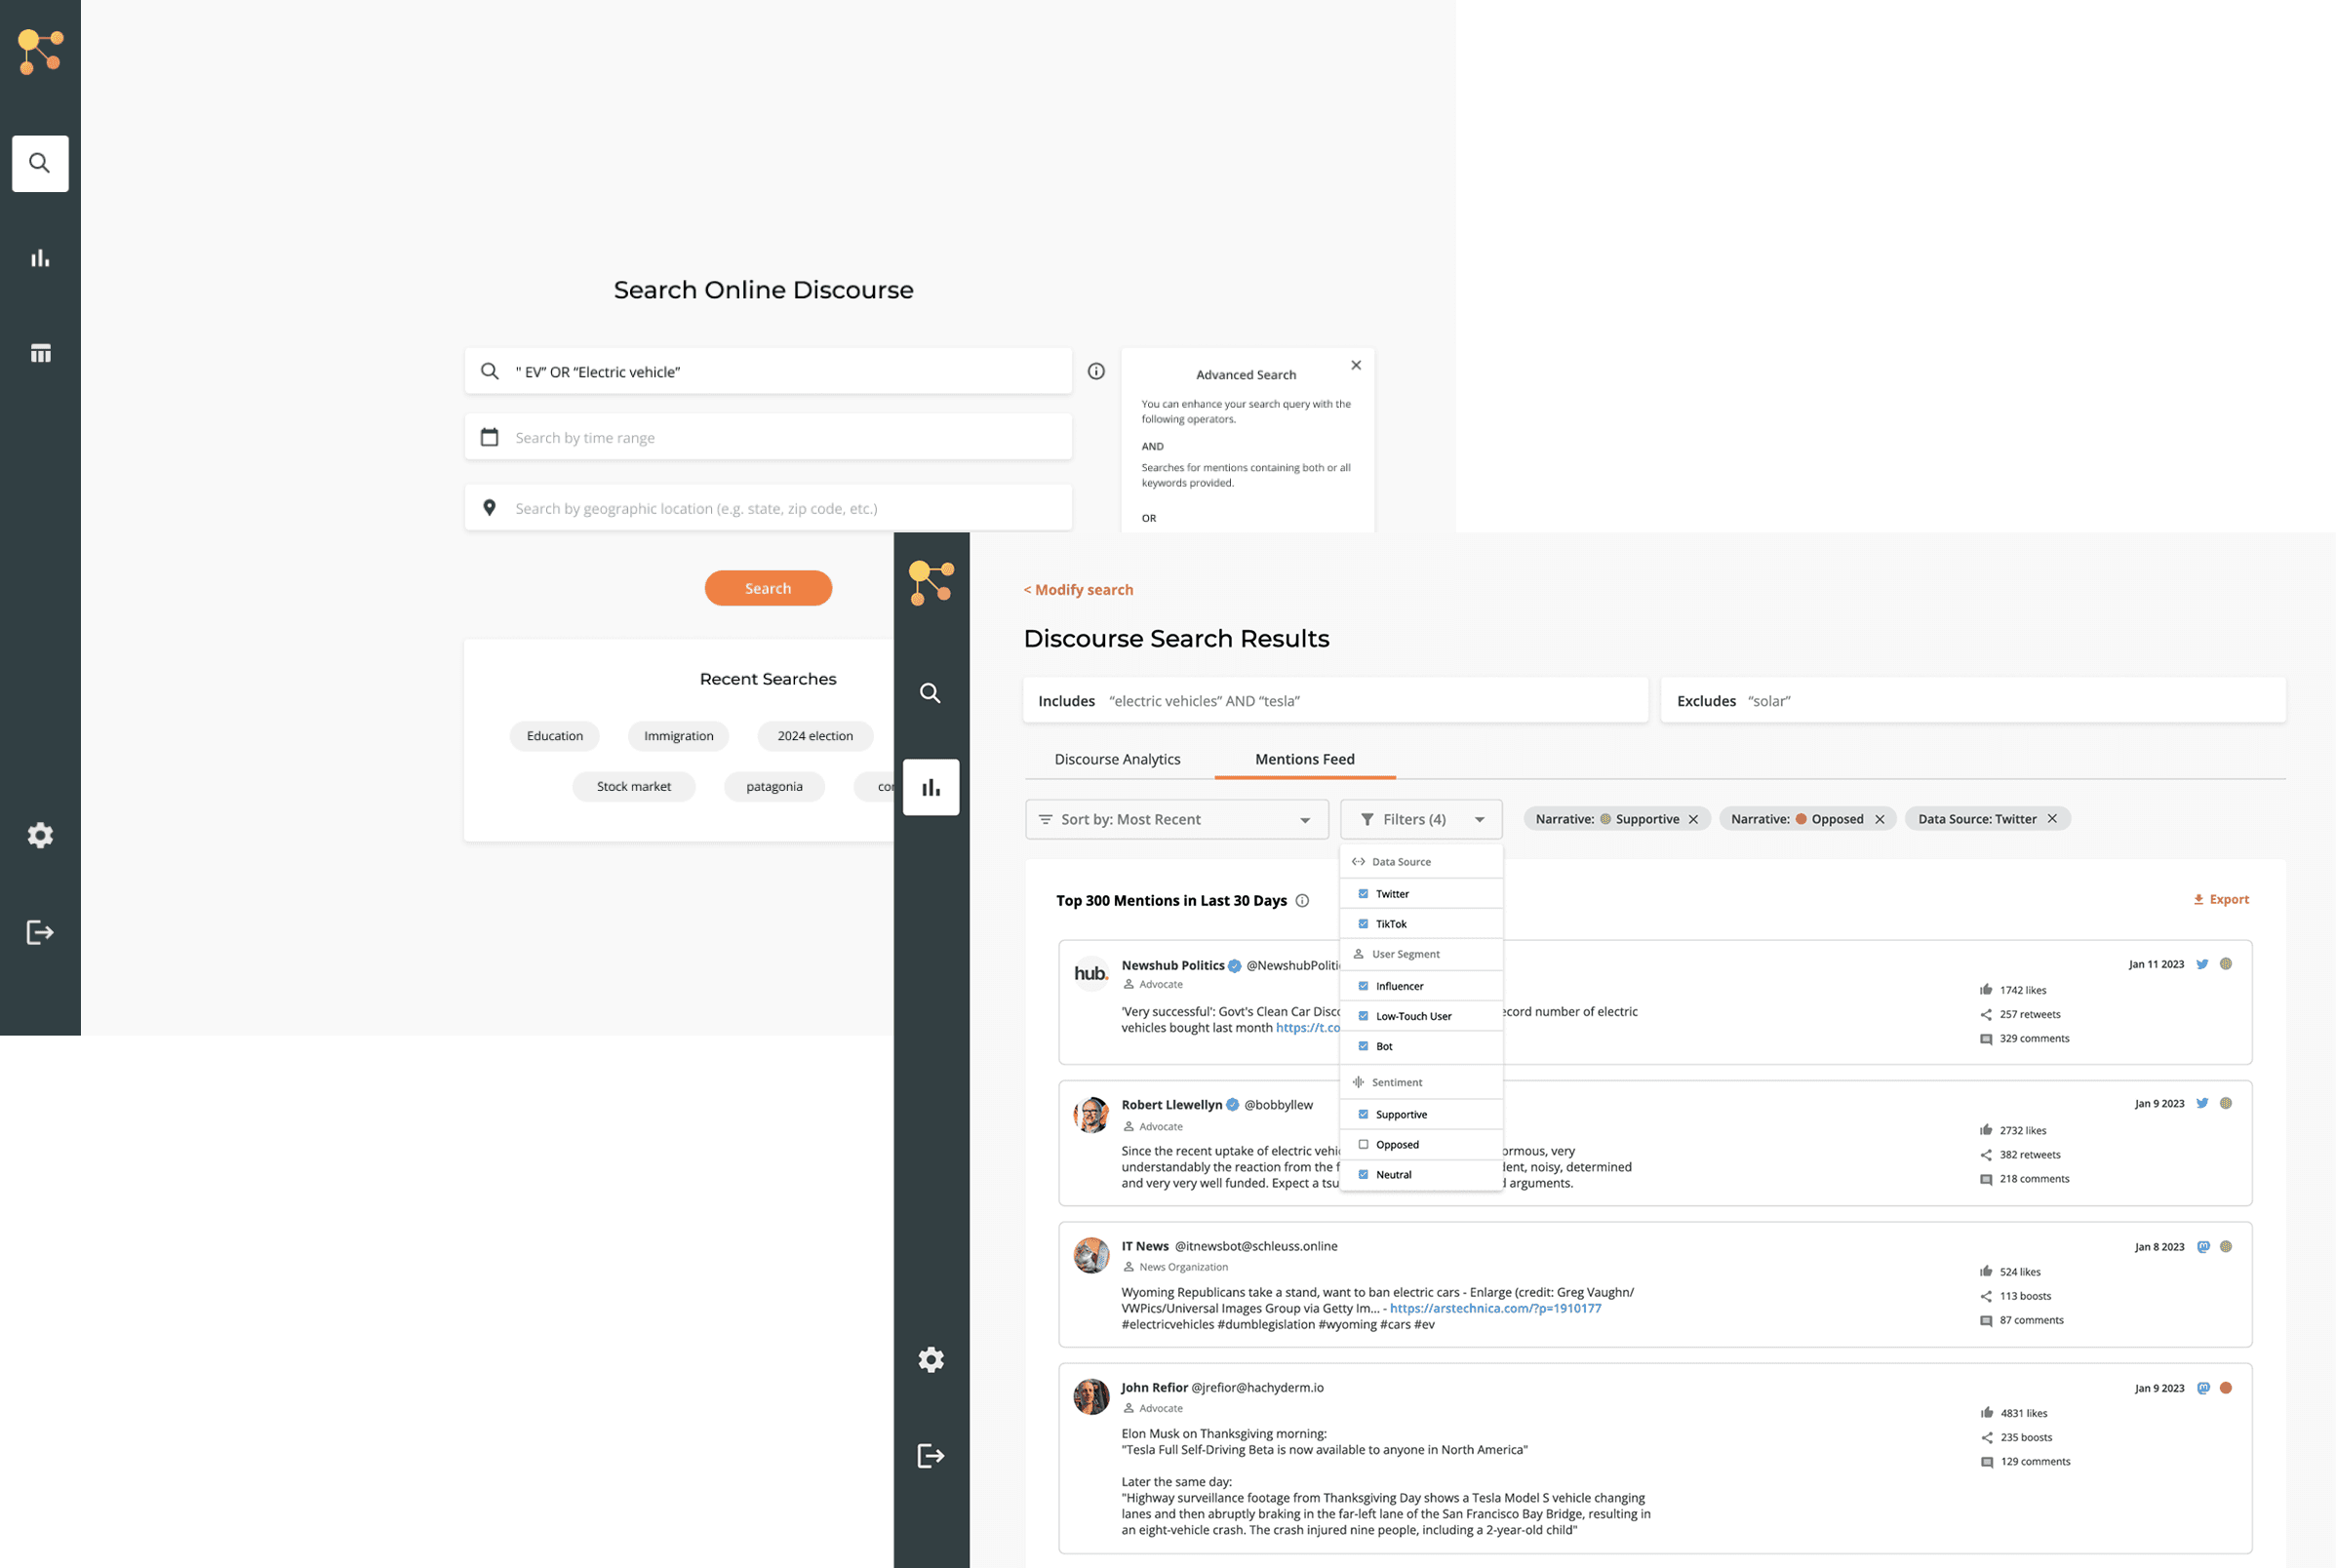
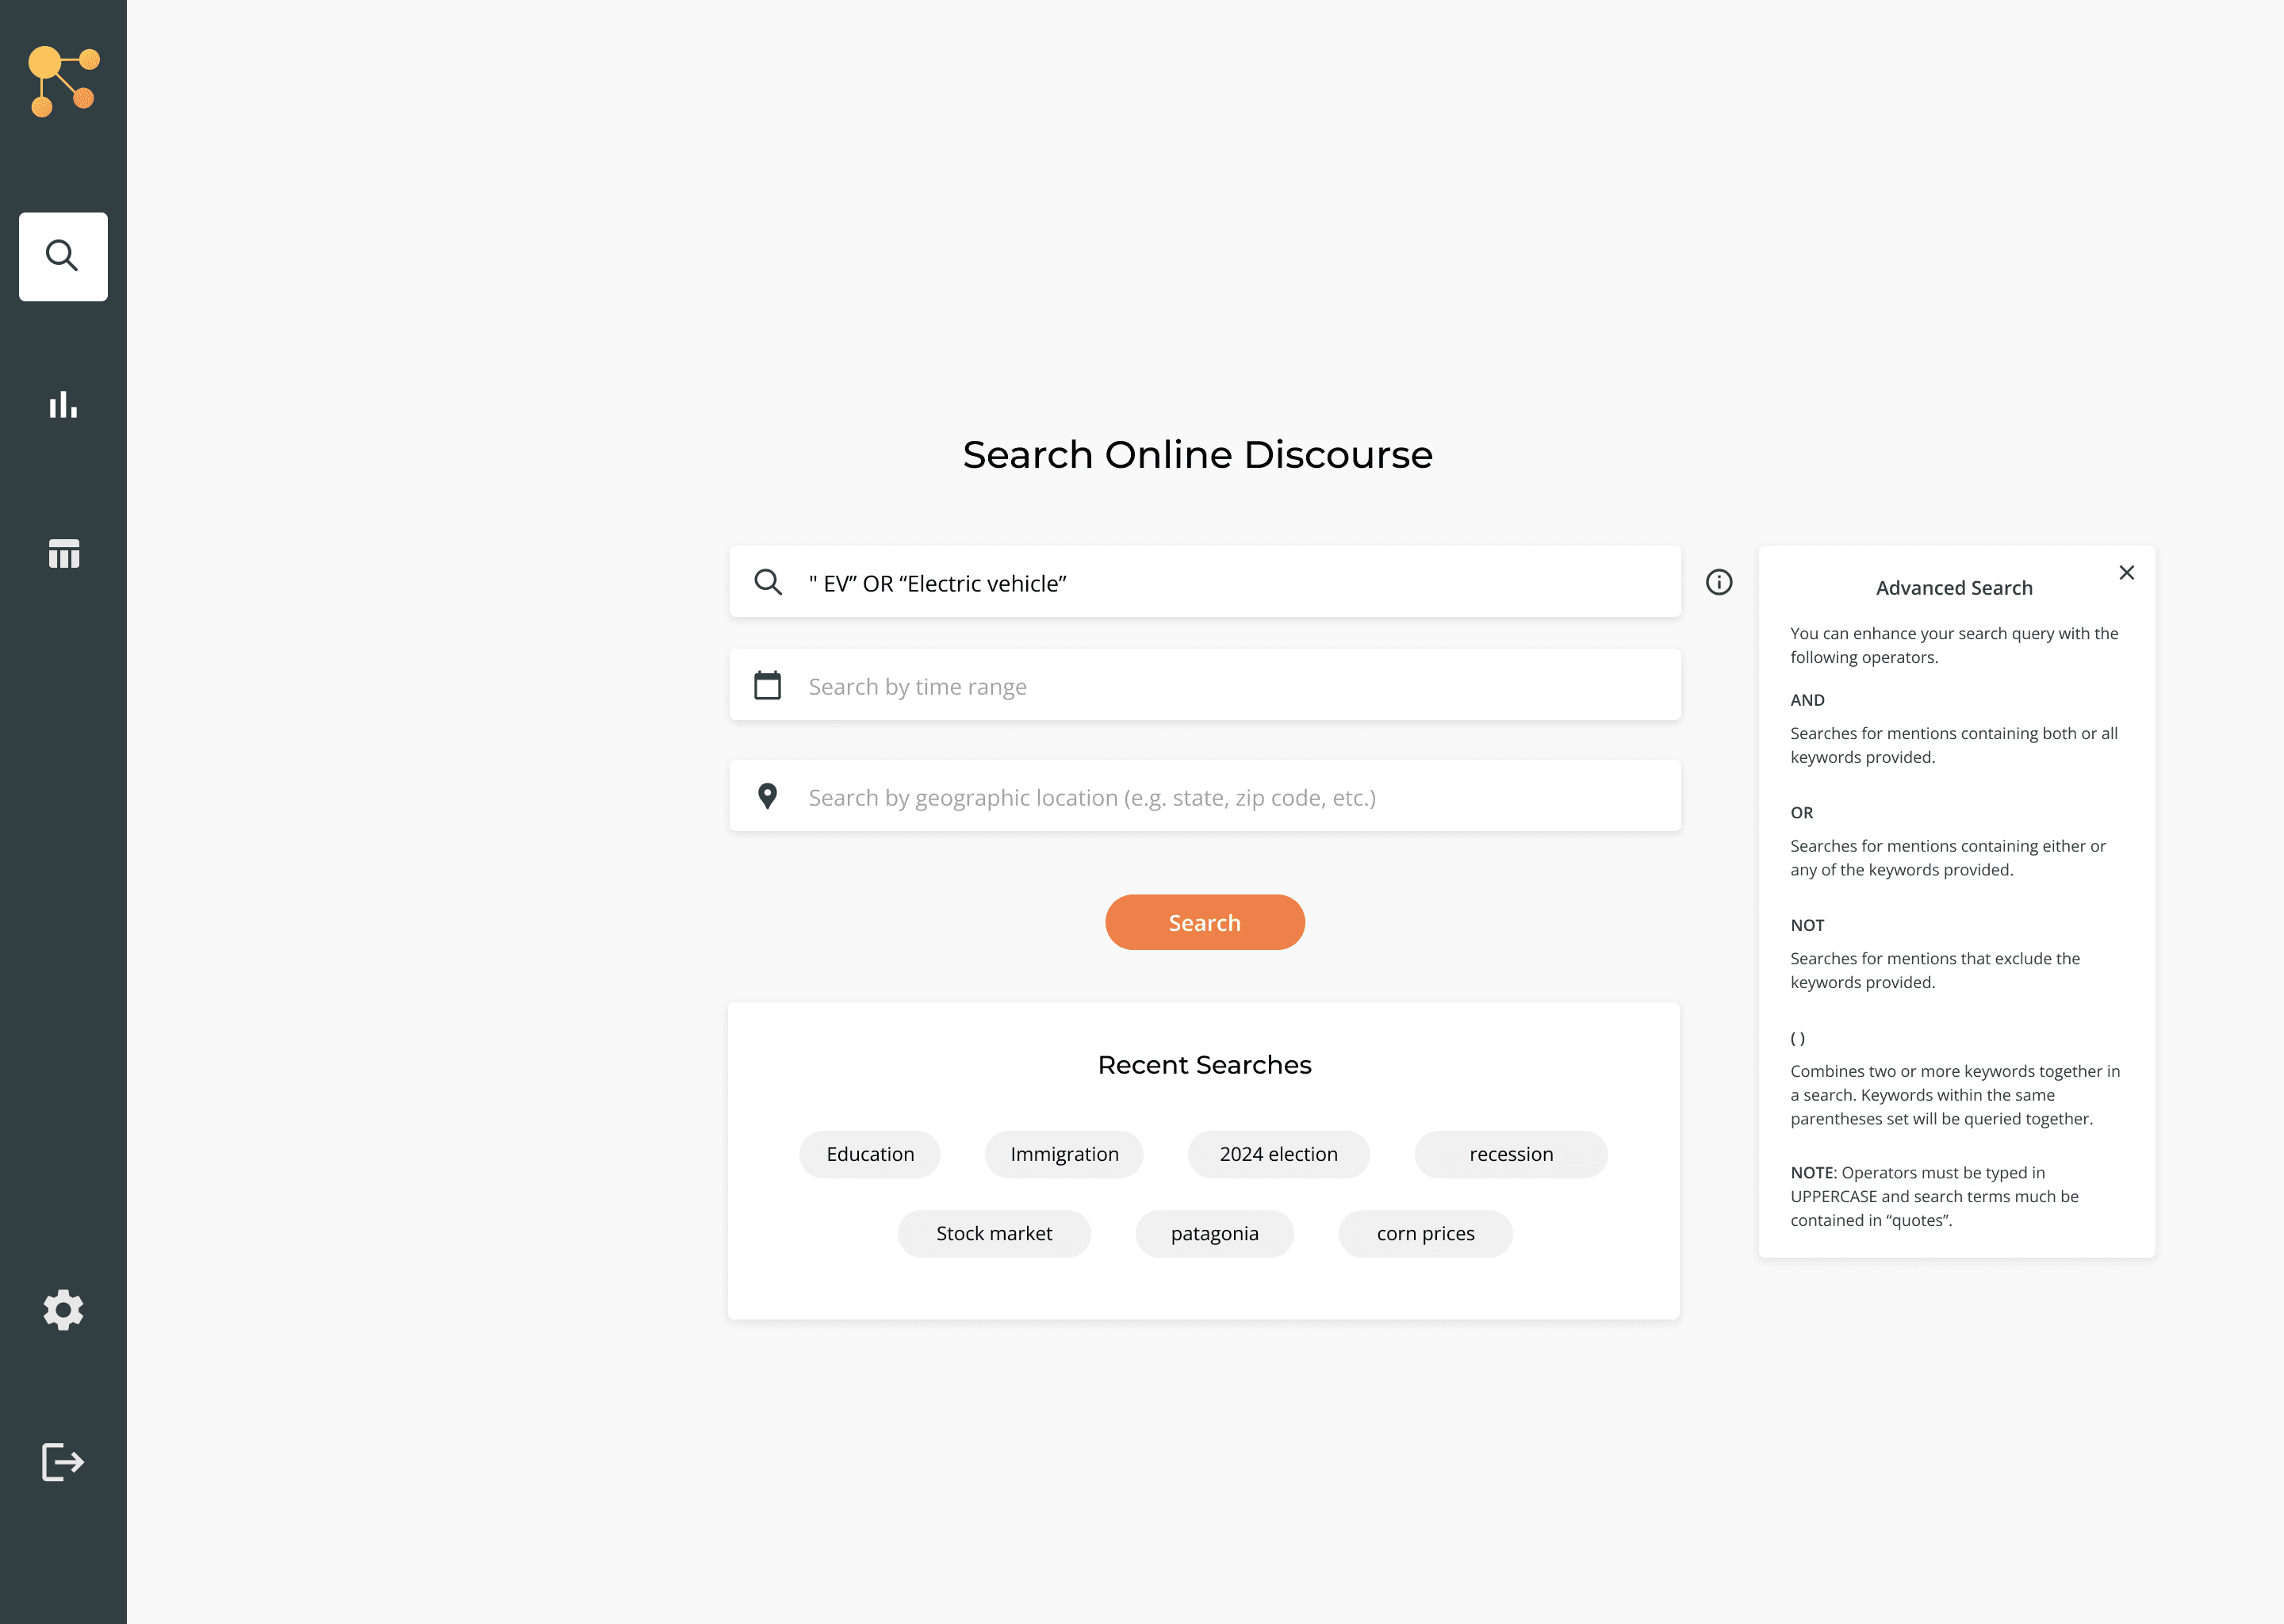
Once the user enters the application, they land on a search interface that presents a typed search input field, a time range field, and a geolocation field.
The user can also utilize any recent searches made on the application.
For MVP, the typed input field would require specific syntax to allow users to build more complex queries. Since this was an advanced feature, I designed a help menu that could be opened to provide information and guidance to the user.
UX OUTCOME
Users can easily understand what parameters can be used in their search and how to compose a more advanced keyword search. The separated time range and geolocation inputs provide affordance cues to the user about additional parameters the system allows for in the search.
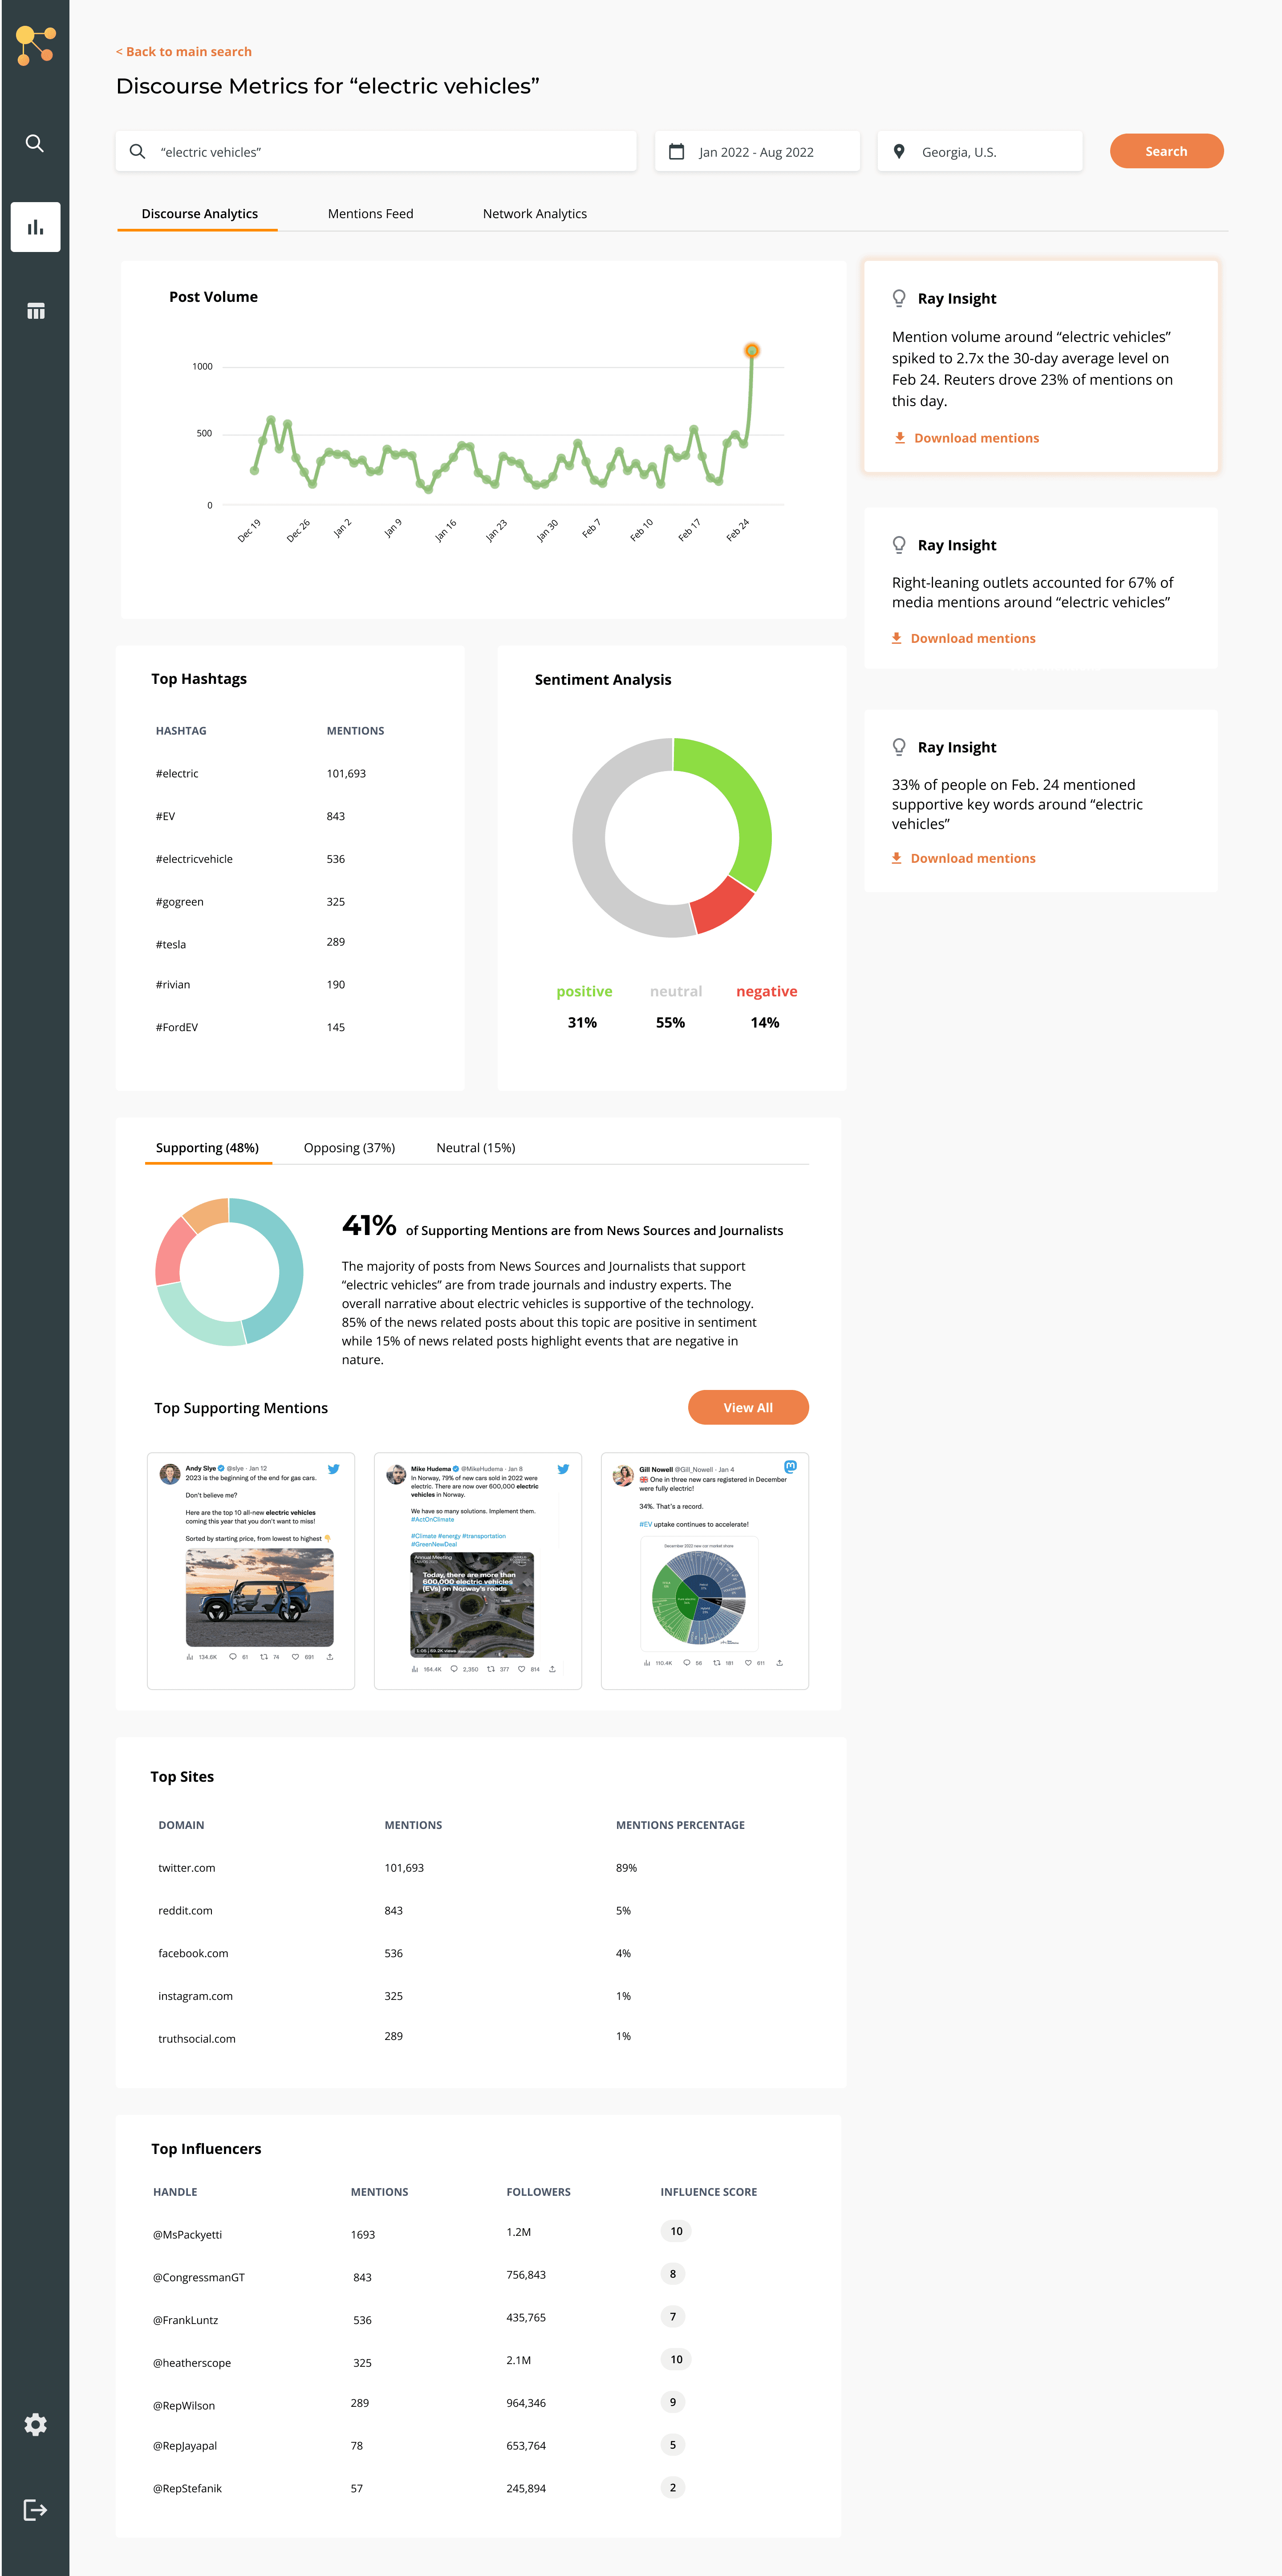
DESIGN DECISIONS
After searching, the user lands on a dashboard view displaying summary statistics of the metrics relevant to the search parameters.
When the user clicks on a specific date on the timeline graph visualization, the metrics below also filter to that date and the system's AI-enabled agent provides tailored insights in natural language.
Mentions counts and sentiment analysis breakdowns are standard practice for target users in the public affairs industry, so these metrics are provided clearly.
UX OUTCOME
Users can quickly scan the dashboard for the key metrics used to build a report for a public relations action plan or political campaign.
DESIGN DECISIONS
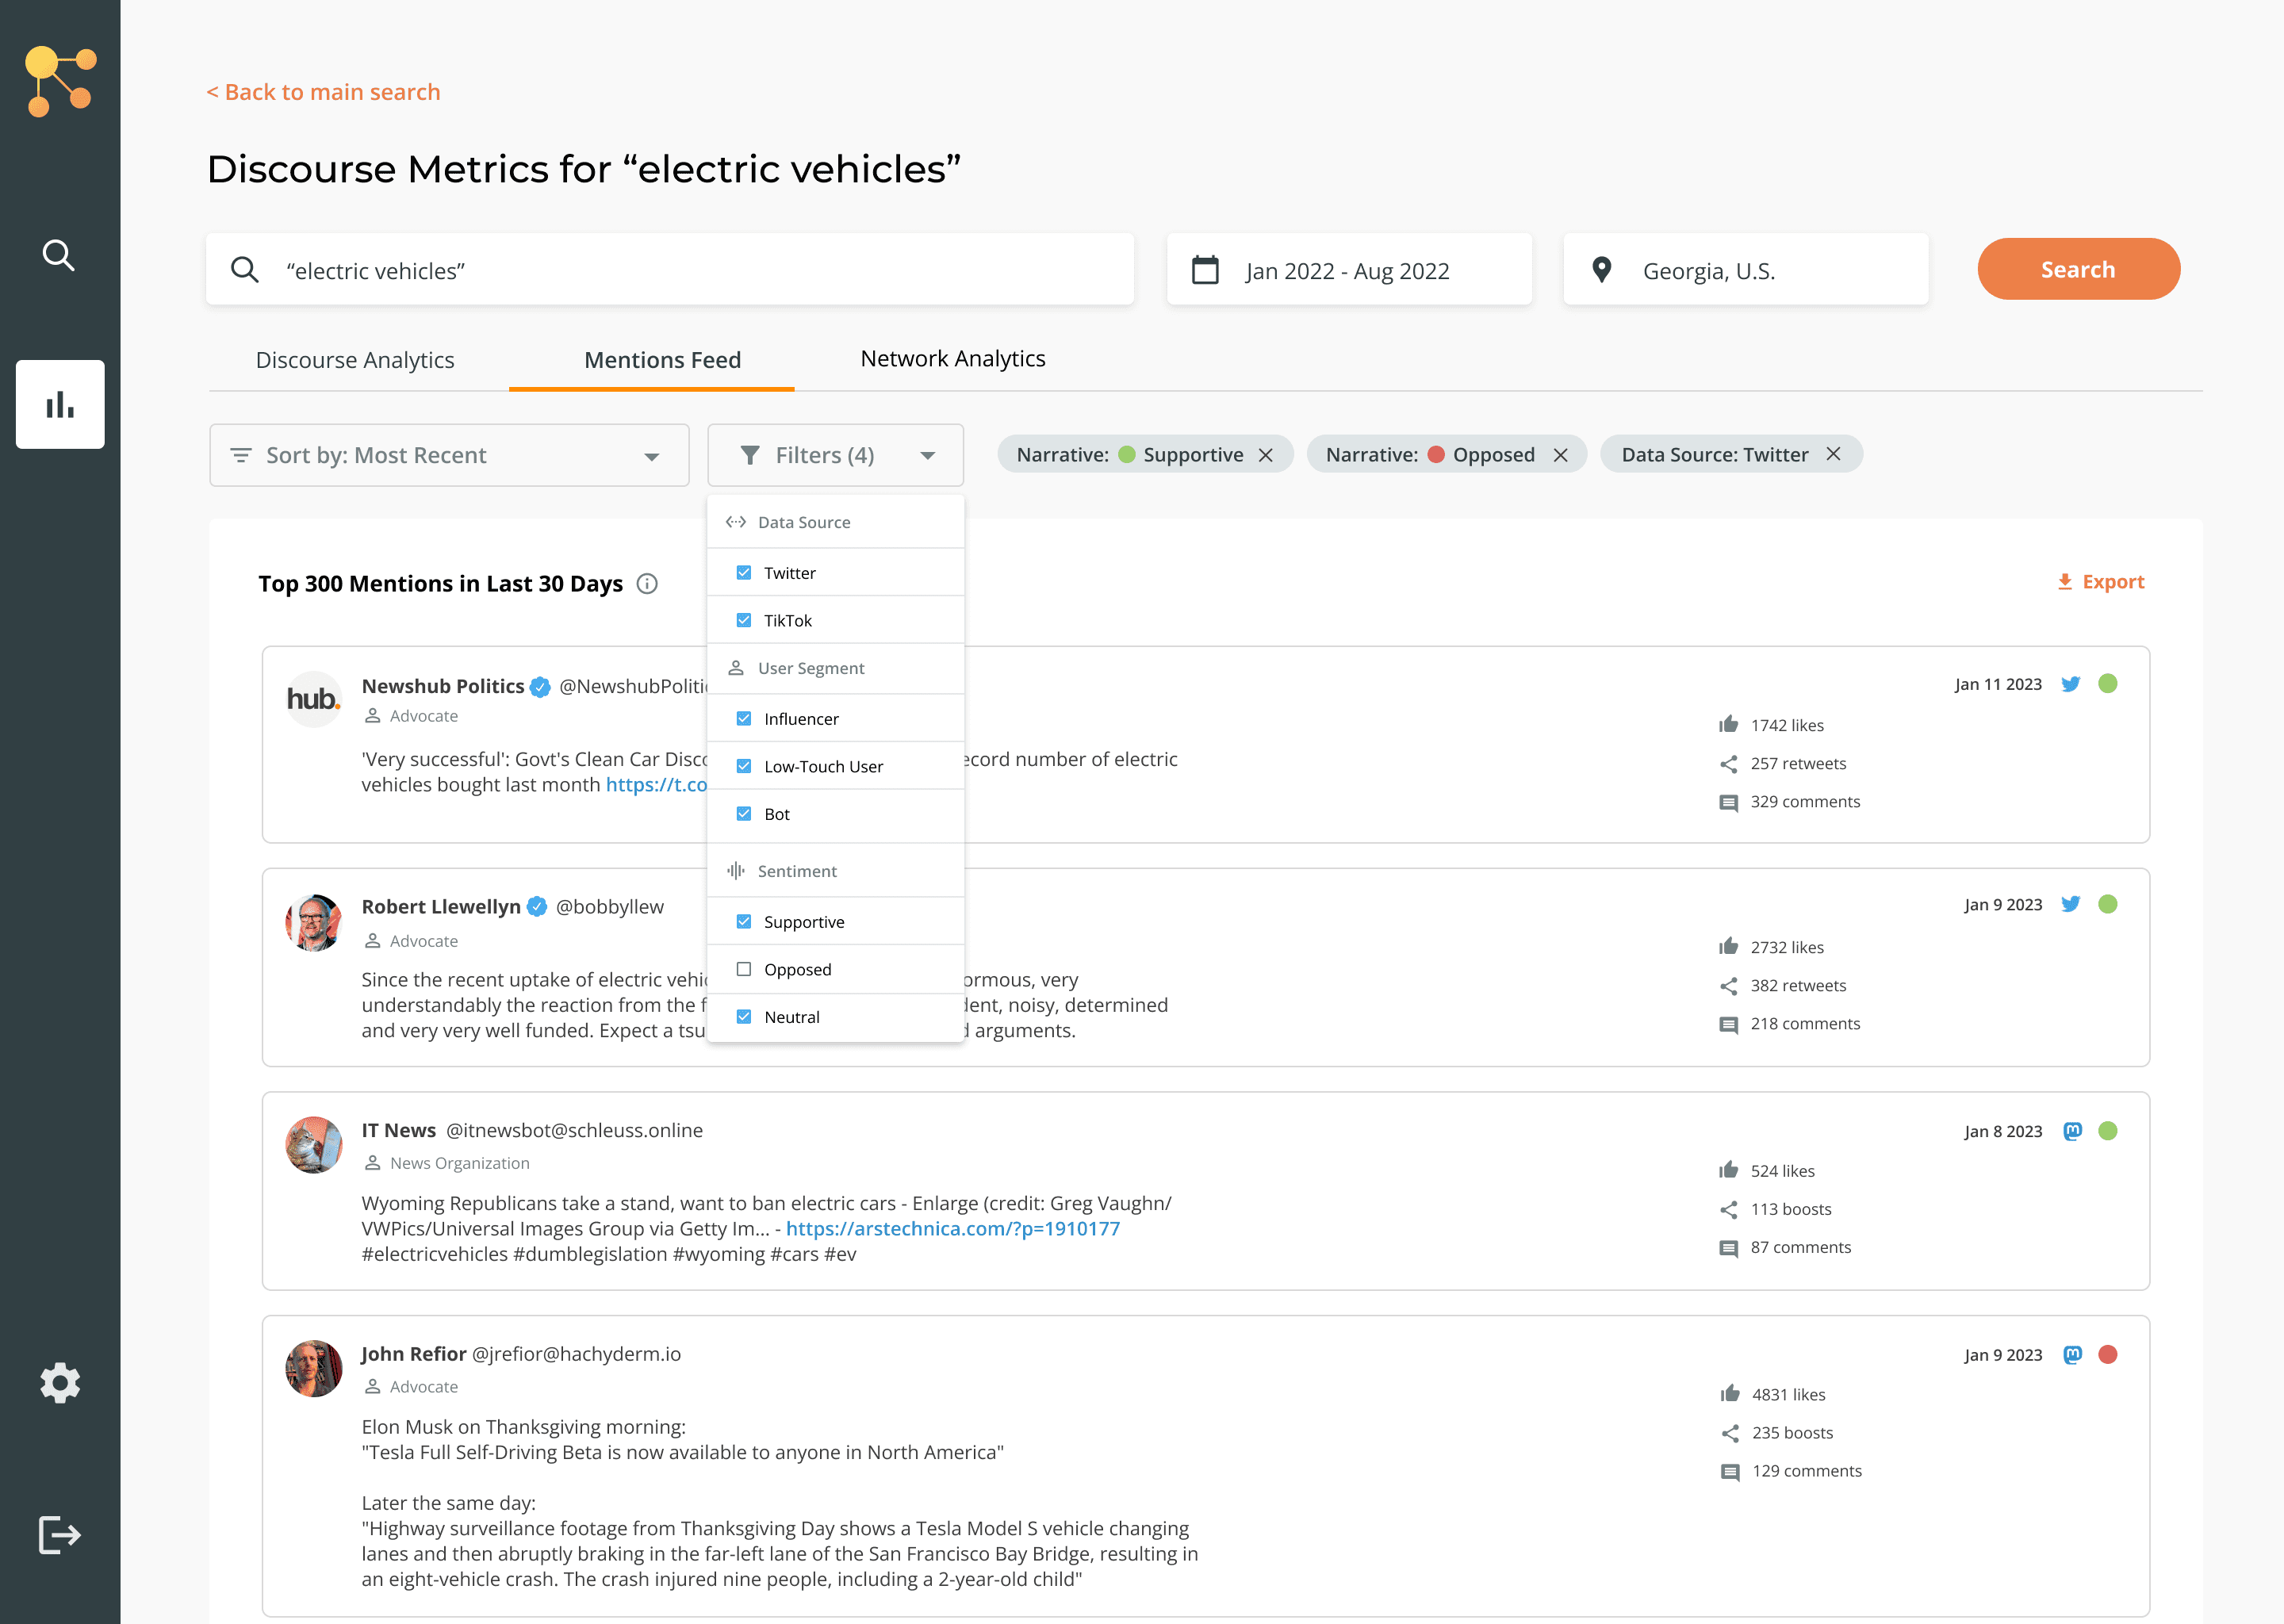
The same data can be viewed in different ways in the other tabs, so the user can pivot to the Mentions Feed tab to view the raw social data that is displayed in the dashboard.
The user can easily apply filters to investigate by data source, user segment, or sentiment and tone.
UX OUTCOME
The user has the freedom and control to navigate the raw data in a user-friendly interface, allowing them to conduct deeper investigation and create a better story to tell in their analysis report.
DESIGN DECISIONS
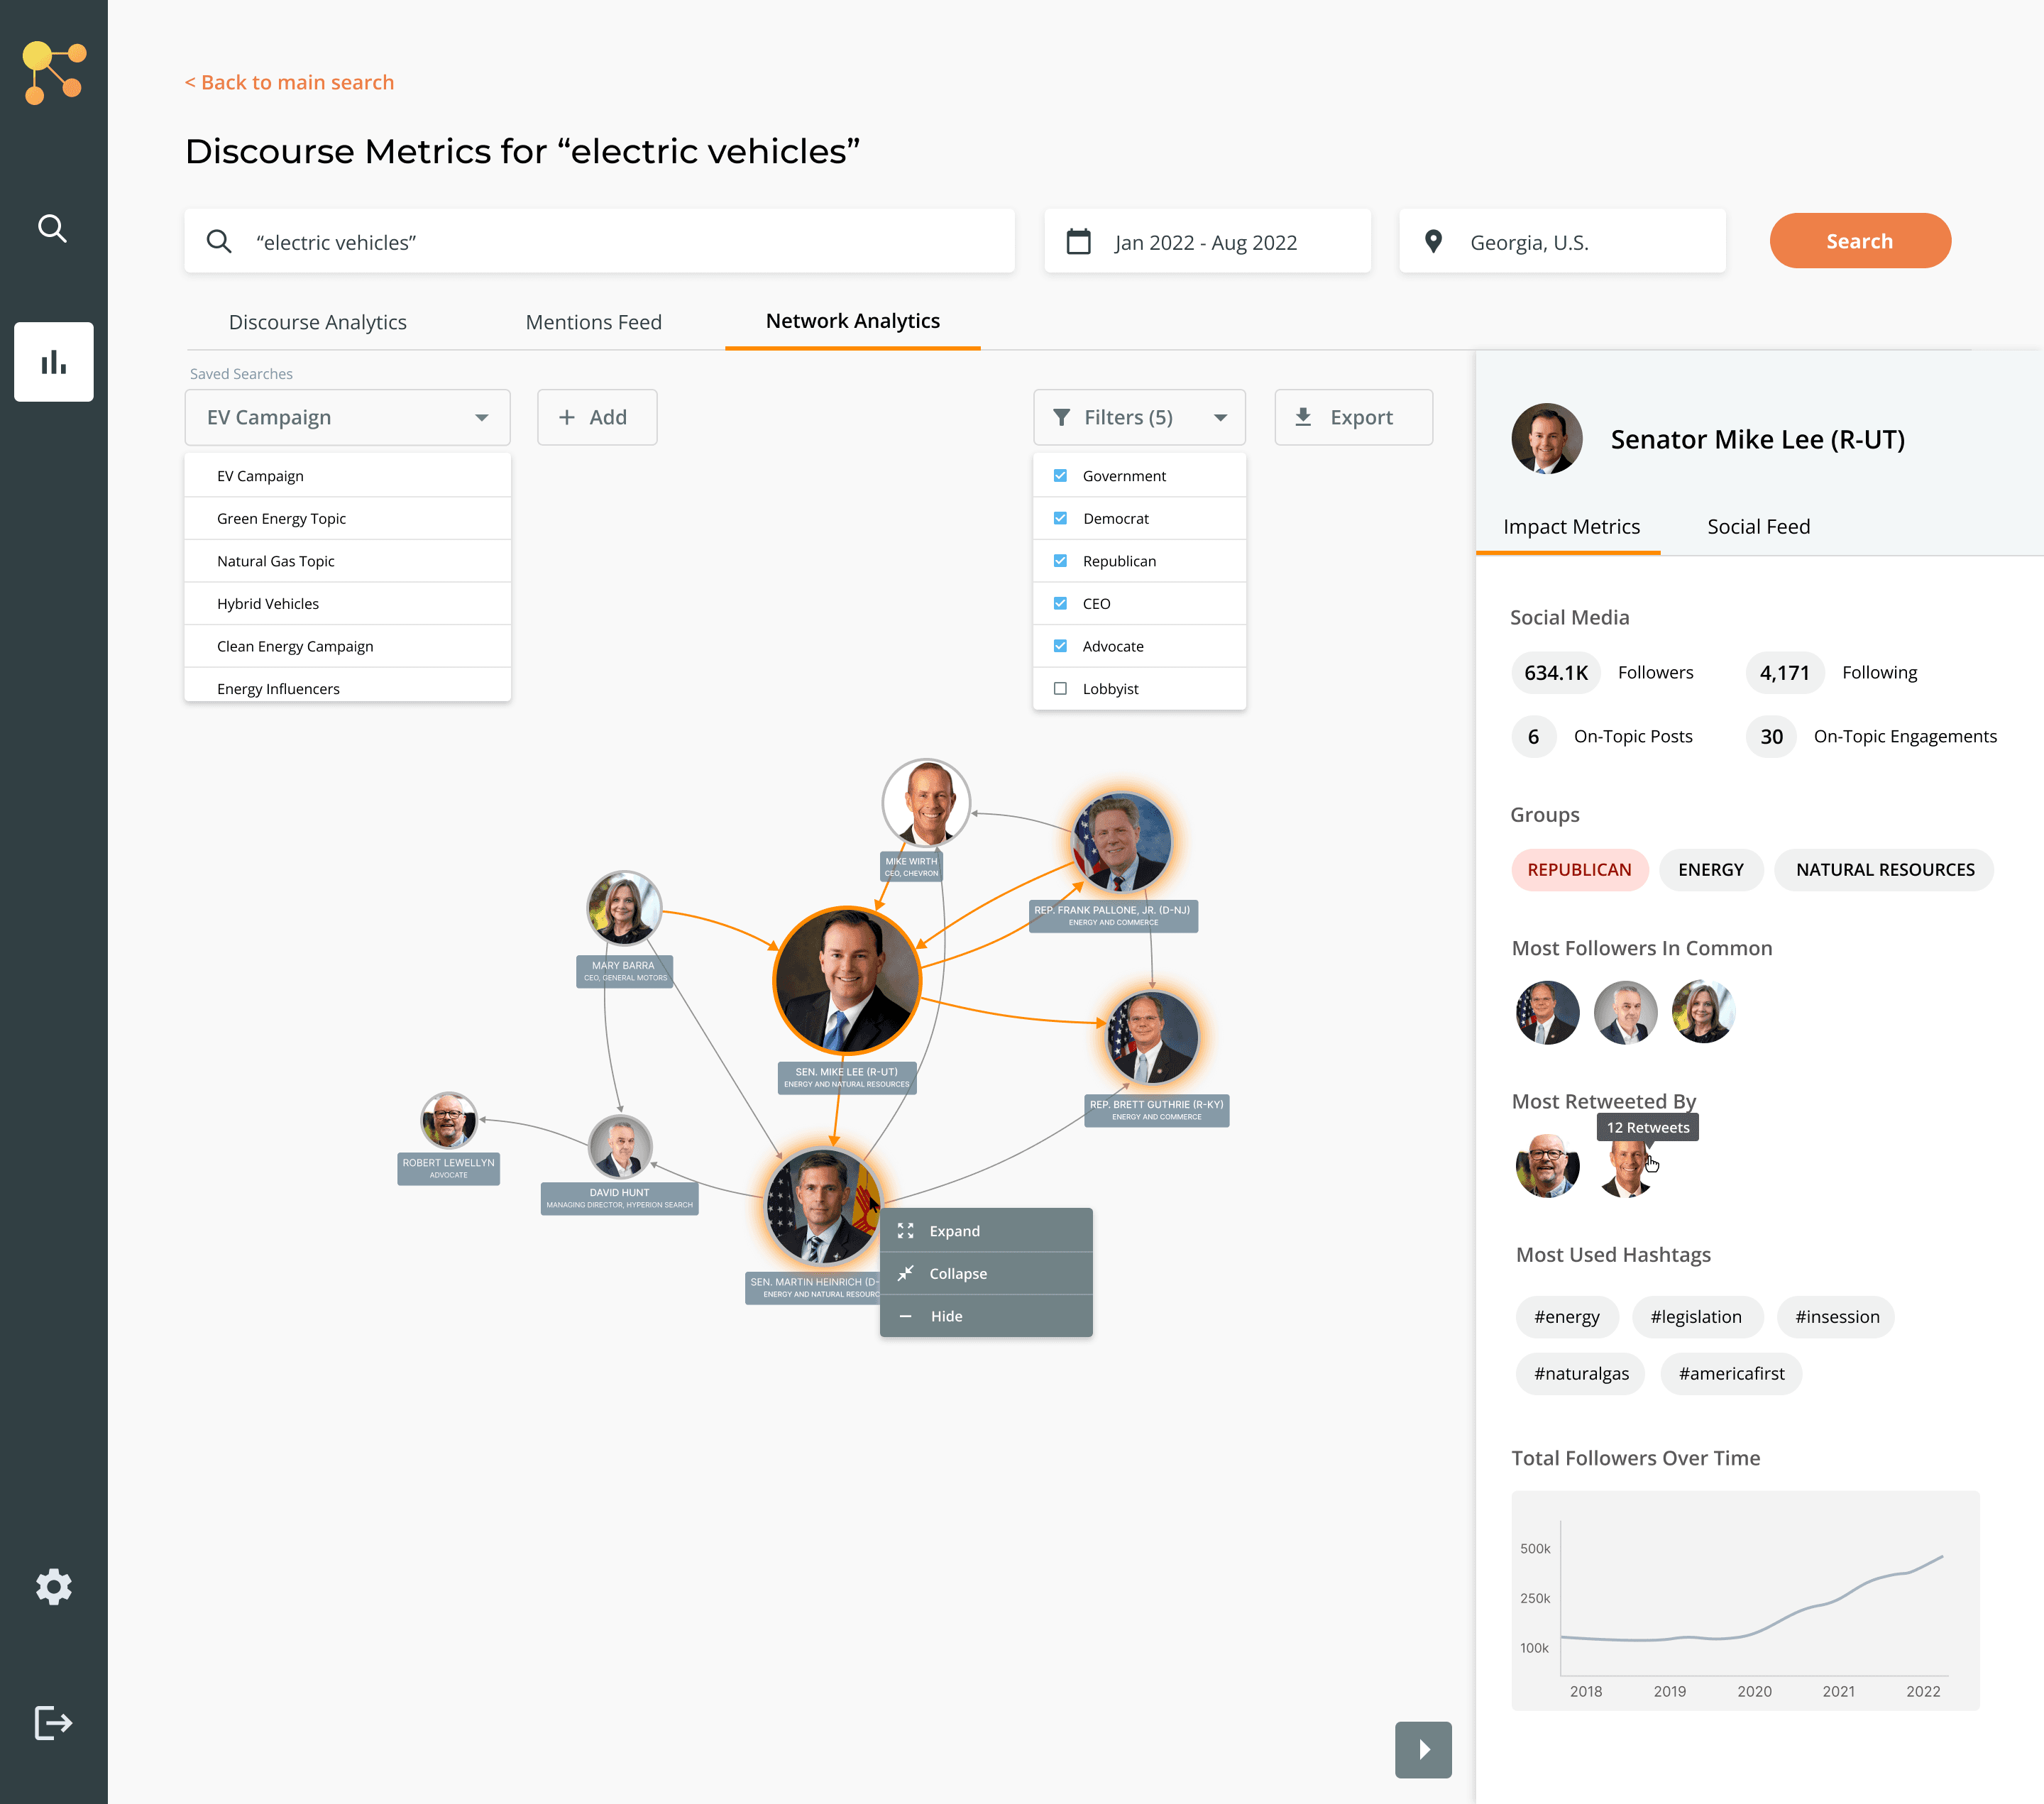
Within the same search parameters, the user can view a network analysis of the major "influencers" within their relevant topic.
An AI/ML algorithm analyzes engagement on posts, follower counts, and other public data to respectively weight the influence of individuals and displays this by node size.
User has the ability to filter the node view based on even more granular segmentation of account personas, compared to the mentions feed.
UX OUTCOME
Users can easily visualize the social landscape, influence level and relationships between key players in the context of the topic of interest.